Normal to enormous ranges
When it comes to measurements, it is tempting to assume that quantities should vary around some center or mean. True, many distributions, from the heights of people to college student grades to the speed of cars on freeways, may conform to a bell curve. But as the physicist Mark Newman writes, “not all things we measure are peaked around a typical value. Some vary over an enormous dynamic range, sometimes many orders of magnitude.”
Power law distributions
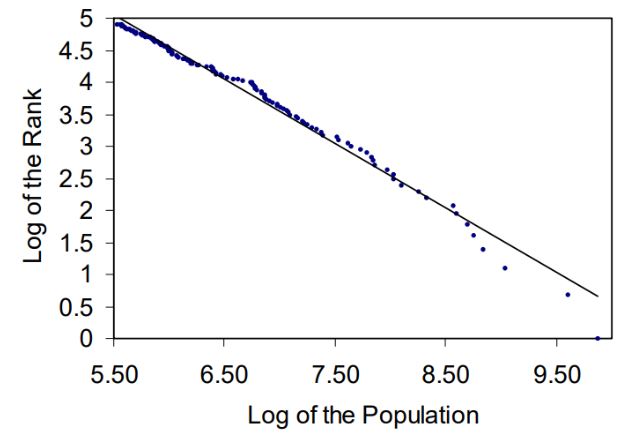
One especially interesting class of things are power-law distributions. We have a power law when the system conforms approximately to the relation Y = c / XA, where Y and X are variables, C is a constant, and A is the power-law exponent. (For context, we sometimes refer to a power-law distribution as a scale-free distribution because the relation maintains its shape no matter the scale at which we look at it.) City populations in the United States, for example, appear to follow a power law distribution known as Zipf’s law (Figure 1). The principle tells us that there are many small cities and a few super hubs like New York and Los Angeles. Despite the variation, city sizes seem to self-organize into a strangely ordered and predictable distribution. As Xavier Gabaix writes in Power Laws in Economics, when it comes to city sizes, “Zipf’s law holds pretty well worldwide” on a country-by-country basis.
Figure 1: Log Size vs Log Rank of the 135 American metropolitan areas
Solar flares to stock prices
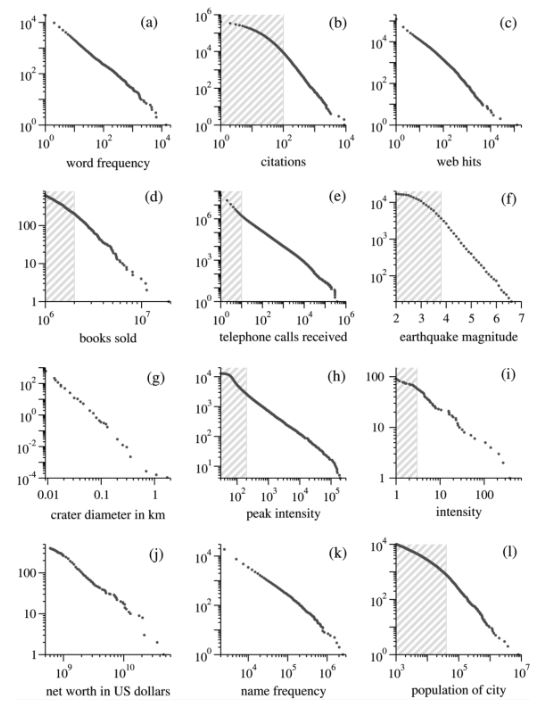
In addition to city population sizes, the distribution of the (a) frequency of words, (b) scientific paper citations, (c) website page hits, (d) sales of books, (e) telephone calls received, (f) earthquake magnitudes, (g) moon crater diameters, (h) intensity of solar flares, (i) intensity of wars, (j) individual net worth, and (k) frequency of family names, all conform approximately to a power-law distribution (Figure 2). (Of course, few phenomena in life conform entirely to a power-law. Hence, we tend to speak about power-law tails or regions in which the distribution holds satisfactorily.)
Figure 4. Cumulative distributions or ‘rank/frequency plots’ of
twelve quantities reputed to follow power laws
Even aspects of market systems may exhibit such structures. In the Misbehavior of Markets, Benoit Mandelbrot writes, for example, that the variation in stock “price movements do not follow the well-mannered bell curve.” He suggests instead that “a power law applies to positive [and] negative price movements of many financial instruments.” Where bell curves treat extreme events as outliers, the fat-tails of power-laws suggest that crashes and ‘black swans’ are more commonplace. They may even be an embedded feature of the system itself. This is consonant with other financial theories like Hyman Minky’s financial instability hypothesis and our day-to-day experience with volatile markets.
Yule process
The list of examples could go on, of course. But I think you get the point. More interesting, I think, is why such structures ought to arise in the first place. It is tempting to assume that a common mechanism exists given the ubiquity of such phenomena. But as Newman notes, it is probably the case that different mechanisms apply to different systems.
Perhaps the most famous suggestion is the Yule process, as first studied by the statistician George Udny Yule. While the math is involved, the intuition is straightforward. As Newman explains, we begin by imagining a system or collection of cities, web pages, or science papers. Every once in a while, a new city is founded, a web page is launched, and a paper is published. But in between these episodes, new people, hyperlinks, or citations are added randomly to the system.
Now here’s the important part. In this process, the probable destination of any new person, hyperlink, or citation is proportional to the existing ‘size’ of the cities, webpages or papers. In other words, cities with more people are more likely to receive the next new person than cities with less people. Popular web pages, papers, and books, likewise, may receive more attention and therefore more chances to get hyperlinks, citations, and sales.
Moreover, under the right parameters, this simple process of proportional random growth is enough to produce a distribution with a power-law in its tail. While Newman describes the Yule process as a “rich-get-richer” scheme, it also goes by many other names today. They include the Simon’s model, the Matthew Effect, cumulative advantage and preferential attachment. (Researchers have a habit of stumbling upon the same mechanism independently.)
The gambler’s ruin
For another mechanism, let us consider a stylised scenario in which people are compelled by the ‘gambler’s ruin’. This is where the person or addict continues to gamble until his or her sum of money falls to zero. What’s interesting, Newman notes, is that “a randomly fluctuating process that undergoes [the] ‘gambler’s ruin’… has a power-law distribution of possible lifetimes.” Such a model may find applications in disparate domains. The lifetimes of biological taxa, for example, might follow a ‘random walk’ in the form of a ‘gambler’s ruin’. Here, new species emerge from time-to-time, floundering about until they fall permanently to extinction. And “it has been argued”, Newman adds, “that the distribution of the lifetimes of genera in the fossil record does indeed follow a power law.”
Self-organized criticality
Another plausible mechanism is self-organized criticality, as first described by Per Bak and colleagues. The term refers to systems whose behavior, after reaching some critical state as a result of its internal dynamics, transitions from small, calm microinteractions to large macro-wide behaviors. To get a feel for criticality, Bak likes to use a sandpile analogy. Imagine, for instance, that there is a stream of sand that trickles gently from the air onto the floor. As the sandpile grows, the grains slide and shuffle mildly and calmly with its neighbors. But every once in a while, at some critical threshold, this “quiet life is interrupted by punctuation—a burst of activity where grains of sand keep tumbling.” What’s curious is that such a process is enough to generate sand shuffles and avalanches that conform in frequency and intensity to a power-law distribution. Big and small, “there will be bursts of all sizes.”
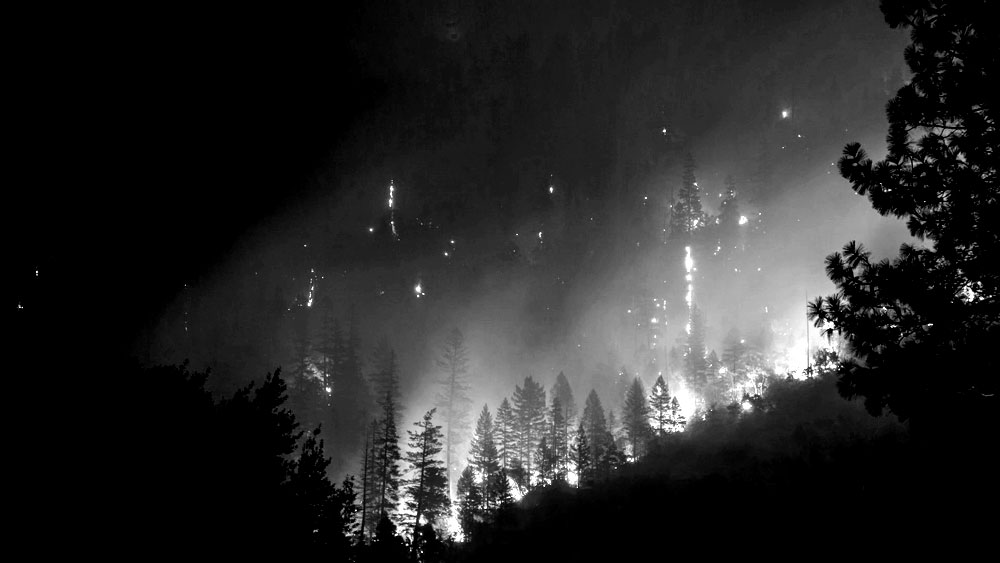
Forest fire models
Another example, Newman notes, are models of forest fires. Here, we have a land mass in which trees sprout randomly at some constant rate. But from time to time, a wildfire erupts—perhaps due to lightning. In this model, fire leaps from tree to tree unless the “firebreak” between the trees is wide enough. We can imagine then that when the forest is young and sparse, lightning is less likely to hit something. And even if it did, the fire would be more localized and less likely to spread. But as the forests grow in density, the chances of intense fires increase. Large infernos, in particular, will reset the thicket—returning us again to sparsity to restart the cycle anew. Under the right parameters, the forest system can self-organize itself, percolating between local and violent fires, between sparse and crowded conditions—all of this again in a power-law like fashion.
Nesting dolls and universality
While these mechanisms are simplifications of real life processes, they may still serve as a useful guide. The Yule process, for example, may help us to explain city populations, website popularity, academic citations, and other social phenomena. Models of self-organized criticality, likewise, may help to model earthquakes, forest fires, solar flares, traffic jams, economic cycles, biological evolution, and other disparate systems. To Bak, such “complexity is a Chinese box phenomenon.” Within each container, from physics to biology to economics, are “all kinds of structure and surprises.” Emergent sandpile structures and power-laws are plentiful, all awaiting discovery and understanding.
We should end here noting that power laws also seem to come in bunches. Mandelbrot notes, for instance, that even insurance claims conform to a power-law distribution. But maybe this is not at all surprising given that earthquakes and other natural disasters exhibit similar structures too. Gabaix writes likewise about the power-laws of firm sizes, executive compensation, and company bankruptcies. If some patterns are persistent as a result of their microinteractions, other systems, dependencies and indicators may follow suit too. Perhaps we might go as far to speculate that because language, book sales, academic citations, and related phenomena follow their own power laws, that the distribution of intensity of human ideas do too.
Sources and further reading
- Newman, Mark. (2004). Power Laws, Pareto Distributions and Zipf’s Law.
- Gabaix, Xavier. (2008). Power Laws in Economics and Finance.
- Bak, Per. (1996). How Nature Works: The Science of Self-Organized Criticality.
- Mandelbrot, Benoit., & Hudson, Richard. (2004). The Misbehavior of Markets.
- Mlodinow, Leonard. (2008). The Drunkard’s Walk.
- Krugman, P. (1995). The Self Organizing Economy.
- Prigogine, Ilya., & Stenger, Isabelle. (1984). Order Out of Chaos.
- Rigney, Daniel. (2010). The Matthew Effect.
Latest
- What’s Eating the Universe? Paul Davies on Cosmic Eggs and Blundering Atoms
- The Dragons of Eden — Carl Sagan on Limbic Doctrines and Our Bargain with Nature
- The Unexpected Universe — Loren Eiseley on Star Throwers and Incidental Triumphs
- Bridges to Infinity — Michael Guillen on the Boundlessness of Life and Discovery
- Ways of Being — James Bridle on Looking Beyond Human Intelligence
- Predicting the Unpredictable — W J Firth on Chaos and Coexistence
- Order Out of Chaos — Prigogine and Stenger on Our Dialogue With Complexity
- How Brains Think — William Calvin on Intelligence and Darwinian Machines
- The Lives of a Cell — Lewis Thomas on Embedded Nature
- Infinite in All Directions — Freeman Dyson on Maximum Diversity